

Optimisation of a gas pipeline
After several remodelling measures a steel manufacturer operates a burner that exhibits pressure pulsations and oscillations within a defined operating mode. The purpose of this burner is to combust furnace gas as well as converter gas. As of the occurring oscillations and thus inadequate combustion stability in this operational area, the plants operability is shortened.
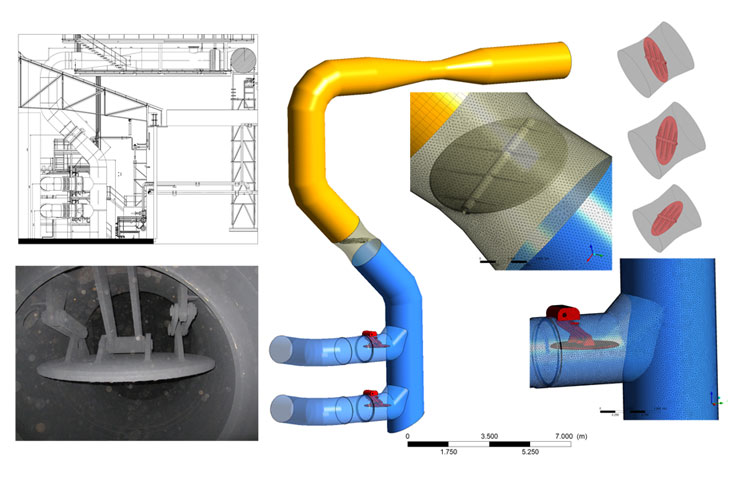
Based on plans and site inspections the mixed gas supply pipeline was modelled with a particular focus on appropriate mesh quality and mesh inflation in sensible areas of the control valve (different positions) and of the rapid-action valve (only in open position). The generated model includes more than 10 million elements and approximately 3.4 million nodes.
The boundary conditions were calculated on the basis of control room script for sample load points, verified and calculated in transient mode. The SST SAS model was used as turbulence model and a time step of 0.002 s was applied. It has to be mentioned that the concept of a SAS turbulence modelling is based on the integration of the Von-Karman scaling of lengths in turbulence equations. Thus, the turbulence model is able to automatically and dynamically switch between the swirl structures to be inflated and the structures to be modelled, and, in doing so, to integrate a Large-Eddy simulation behaviour into the transcient Reynolds-averaged Navier-Stokes equations.
After calculations referring to the initial situation have been performed, different types of improvements have been elaborated together with client whereas the most important parameters were feasibility and fast realisation.
The variations are depicted in the figure following – top left: the valve has been moved to the upper region; top middle: the valve has additionally been rotated 90°; top right: the valve has supplementary components and thus a slightly different valve position for the same operating point; bottom left: a rectifier has been installed after the valve; bottom middle: together with the rectifier a guidance plate is planned as well; bottom right: in this variation the valve has been mounted at its actual position however rotated by 90°.
In general, the calculations take some time – between 300 to 500 time steps – until a steady state effect can be detected. However, even during this period of time the flow diagram changes permanently. By means of films, the particular load cases are analysed and visually evaluated with regard to their flow as an evaluation based on quantitative flow parameters delivers inadequate results.

The variation with the rectifier has to be judged as totally inappropriate, as the rough rectifier provides no homogenisation of the flow. However, the installation of a more efficient rectifier or a perforated plate has to be excluded as pressure losses would be too high, and as the pressure difference is a mandatory boundary condition
In a first step, the valve has been installed in a rotated position which led to a reduction of pulsations during operation. Based on these findings further measurements and calculations were performed.
.